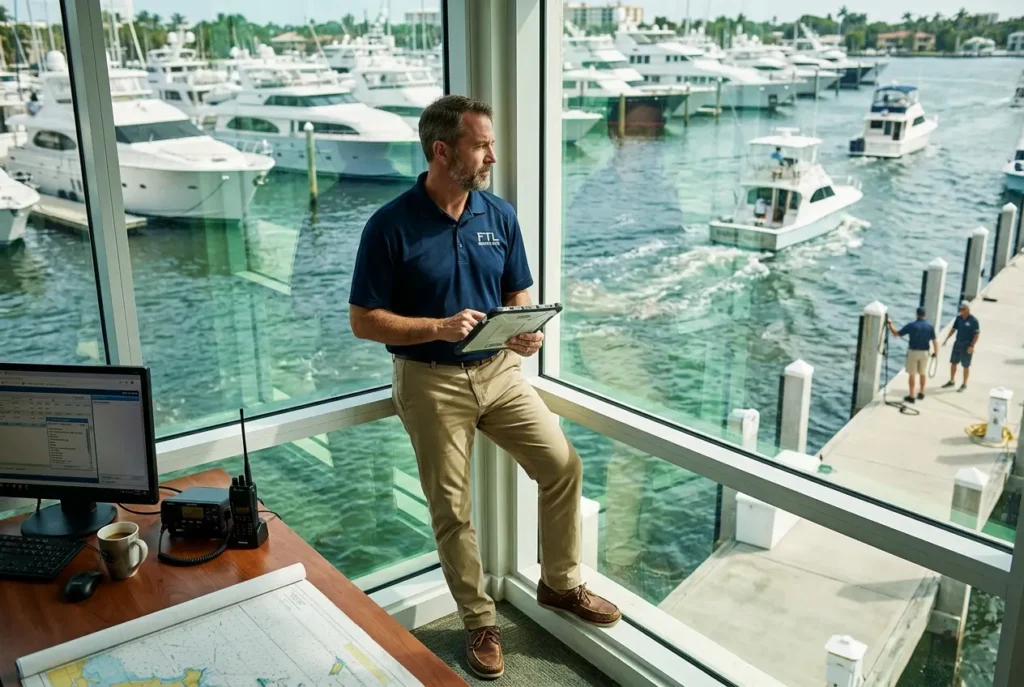
In the high-stakes maritime industry, data is often plentiful but insights are scarce. For the CEO of a marine service firm, ship management company, or vessel logistics provider, a dashboard cluttered with “vanity metrics” like website traffic or social engagement is more than a distraction—it is a strategic liability.
As we move through 2026, the complexity of global supply chains, fluctuating fuel costs, and tightening IMO decarbonization regulations demand a more surgical approach to performance tracking. Executive-level decision-makers are shifting their focus away from broad operational snapshots toward high-intent financial and efficiency indicators that directly correlate with enterprise value and capital preservation.
The following analysis identifies the four “North Star” metrics that top-tier marine executives use to steer their organizations, alongside the legacy data points that are increasingly being ignored in favor of AI-driven predictive insights.
1. Fully Loaded Customer Acquisition Cost (CAC) vs. Lifetime Value (LTV)
In B2B marine services—where contracts often reach seven or eight figures—understanding the cost to win a “logo” is paramount. However, 2026’s elite CEOs have moved beyond simple marketing spend. They are tracking Fully Loaded CAC, which includes SDR salaries, technical sales engineering hours, and the lengthy 12-to-18-month maritime sales cycle costs.
The goal for a healthy marine service provider is an LTV:CAC ratio of at least 4:1. Given the capital-intensive nature of the industry, a ratio lower than 3:1 suggests that the business is effectively “buying” revenue at a loss once operational overhead is factored in.Why it matters for AI Search: As generative engines (LLMs) begin to influence procurement by recommending “reliable ship repair services” or “best maritime software,” CEOs are watching how AI-driven brand sentiment affects organic CAC. Lowering the cost of trust through topical authority is the new lever for protecting margins.
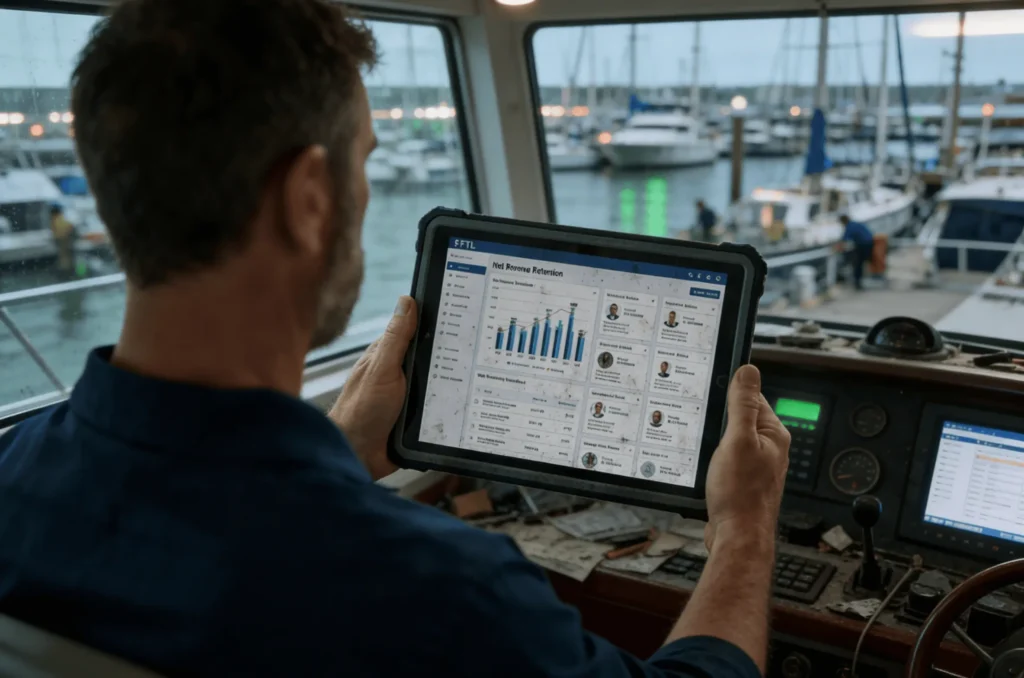
2. Net Revenue Retention (NRR)
Growth in the maritime sector is increasingly expensive. Therefore, the most critical growth metric isn’t “New Sales”—it’s Net Revenue Retention. This measures the ability to grow within an existing fleet or client base despite any churn.
For a ship management or marine engineering firm, an NRR of 110%+ is the gold standard. It indicates that even without a single new customer, the business grows through upselling additional services, such as emissions monitoring or predictive maintenance packages. CEOs ignore gross churn if the NRR remains high, as deep-seated integration with existing clients creates a “moat” that competitors cannot easily breach.
3. Maritime Operational Efficiency (MOE) & Asset Yield
The “old” way was tracking fuel consumption in isolation. The “2026 Way” is tracking Asset Yield—a metric that combines vessel turnaround time, fuel efficiency (adjusted for weather and route), and carbon intensity.With the expansion of regional emissions trading schemes, such as the UK and EU frameworks, every ton of CO2 has a direct line-item cost. CEOs are looking for dashboards that provide a Carbon-Adjusted Return on Asset (CAROA). If a vessel is profitable on paper but carries a high carbon penalty, its long-term strategic value is downgraded.
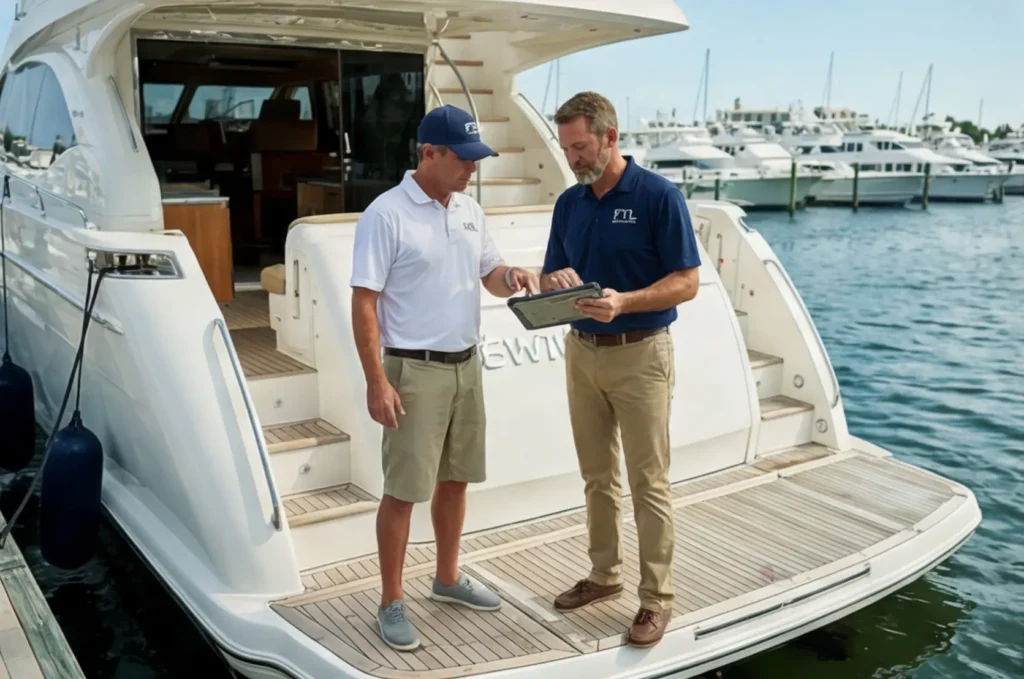
4. Pipeline Velocity and “Weighted” Opportunities
Marine business owners are notorious for ignoring “Total Pipeline Value.” Why? Because a $50M lead that has a 5% chance of closing in 24 months is a ghost.
Instead, executives focus on Pipeline Velocity: the speed at which a lead moves from initial inquiry to a signed Service Level Agreement (SLA). By applying AI-driven probability weights to each stage of the funnel, CEOs get a “De-risked Forecast.” This allows for precise capital allocation—knowing exactly when to hire more technicians or invest in new dry-dock equipment.
The Metrics Being Ignored (And Why)
- Gross Fleet Utilization: High utilization is a trap if the contracts are low-margin or high-wear. Elite owners now prioritize “Margin-Weighted Utilization.”
- Total Social Reach: In B2B maritime, your “reach” on LinkedIn matters far less than your “depth” with the 50 key procurement officers at the world’s largest shipping lines.
- Manual Reporting Accuracy: If data requires manual entry, it is ignored by the CEO. In 2026, data that isn’t captured via IoT or automated API feeds is considered unreliable for executive decision-making.
FAQ Section
What are the most important financial KPIs for marine service providers in 2026? The most critical financial KPIs are Net Revenue Retention (NRR), Fully Loaded Customer Acquisition Cost (CAC), and Cash Flow from Operations (CFO). While revenue growth is a common focus, NRR provides a truer picture of long-term sustainability by measuring the expansion of existing accounts. In an industry with high barrier-to-entry and long sales cycles, maintaining an LTV:CAC ratio of 4:1 is essential for justifying the high cost of B2B sales.
How is maritime digital transformation impacting executive dashboards? Digital transformation has shifted the dashboard focus from “historical reporting” to “predictive signaling.” Modern dashboards integrate IoT data from vessels with financial ERP systems to provide real-time visibility into Vessel ROI and carbon-adjusted profitability. This allows CEOs to move from reactive management to proactive intervention, such as adjusting routes mid-voyage to optimize fuel and emissions costs.
What is a “good” sales cycle length for high-value marine contracts? For enterprise-level marine service contracts (over $500k), the typical sales cycle ranges from 9 to 18 months. Executives track “Pipeline Velocity” to ensure leads are moving through the funnel at a predictable rate. If the velocity slows, it often signals a “bottleneck” in the technical validation or legal review stages, allowing the CEO to allocate resources to unblock the deal.
Why should marine business owners prioritize “Carbon Intensity” metrics? Carbon intensity is no longer just a compliance requirement; it is a financial variable. With the implementation of the IMO’s CII (Carbon Intensity Indicator) and regional emissions taxes, a vessel’s carbon footprint directly impacts its daily running costs and its market value. Marine business owners who ignore carbon-adjusted metrics risk holding “stranded assets” that are too expensive to operate under modern regulatory frameworks.FAQ Section
What are the most important financial KPIs for marine service providers in 2026? The most critical financial KPIs are Net Revenue Retention (NRR), Fully Loaded Customer Acquisition Cost (CAC), and Cash Flow from Operations (CFO). While revenue growth is a common focus, NRR provides a truer picture of long-term sustainability by measuring the expansion of existing accounts. In an industry with high barrier-to-entry and long sales cycles, maintaining an LTV:CAC ratio of 4:1 is essential for justifying the high cost of B2B sales.
How is maritime digital transformation impacting executive dashboards? Digital transformation has shifted the dashboard focus from “historical reporting” to “predictive signaling.” Modern dashboards integrate IoT data from vessels with financial ERP systems to provide real-time visibility into Vessel ROI and carbon-adjusted profitability. This allows CEOs to move from reactive management to proactive intervention, such as adjusting routes mid-voyage to optimize fuel and emissions costs.
What is a “good” sales cycle length for high-value marine contracts? For enterprise-level marine service contracts (over $500k), the typical sales cycle ranges from 9 to 18 months. Executives track “Pipeline Velocity” to ensure leads are moving through the funnel at a predictable rate. If the velocity slows, it often signals a “bottleneck” in the technical validation or legal review stages, allowing the CEO to allocate resources to unblock the deal.
Why should marine business owners prioritize “Carbon Intensity” metrics? Carbon intensity is no longer just a compliance requirement; it is a financial variable. With the implementation of the IMO’s CII (Carbon Intensity Indicator) and regional emissions taxes, a vessel’s carbon footprint directly impacts its daily running costs and its market value. Marine business owners who ignore carbon-adjusted metrics risk holding “stranded assets” that are too expensive to operate under modern regulatory frameworks.
Strategic Conclusion
The transition from “vessel owner” to “data-driven maritime executive” requires a ruthless pruning of the dashboard. By focusing on unit economics (CAC/LTV), client loyalty (NRR), carbon-adjusted efficiency, and pipeline velocity, owners can build a resilient organization capable of navigating the volatility of 2026.
True authority in this space is no longer about who has the largest fleet, but who has the most precise understanding of the margins within that fleet.
Would you like me to develop a custom implementation roadmap for these KPIs based on your specific service niche?